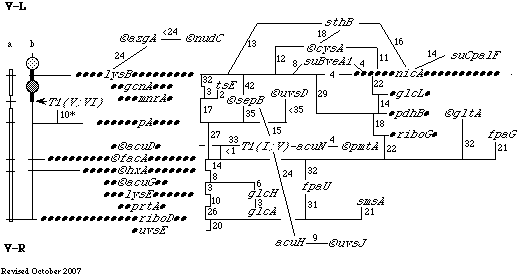
Chromosome V Map
The top of the diagram represents the conventional left of the chromosome, and the bottom, the right. See below and V Linkage data
for explanation.

Mitotic map
The vertical lines on the left of the map show mitotic mapping. The open boxes show
markers located by heterozygosity in translocation disomics to chromosome segments
separated by T1(V;VII). The bold vertical line shows that this translocation has been
located to two possible centromere positions by mitotic recombination, while the
thinner extensions to this line show markers distal to it, or on the other chromosome
arm, that are not ordered by this method. See Chromosome V
data for references.
Meiotic map
Some of the linkage data for this chromosome are conflicting, so for this chromosome
only, a choice of which data to display in the map has in some cases been made by
reference to the genome sequence.
Vertical lines indicate links whose orientation has been determined relative
to neighbouring genes. For markers connected by
horizontal or diagonal lines, the distance is recorded, but orientation is not.
Two columns of markers have been ordered relative to each other, but the relationship
between the two sets is uncertain. In particular, lysB and nicA, which
have been used in many crosses, have not been satisfactorily ordered relative
to the centromere or to other markers. The number of bullets before and after each
locus denotes the number of linkages noted from the literature, to markers
respectively left and right of the locus. In general, only the distance to the nearest
marker is shown; see linkage data for other distances.
See Linkage data for genes located to V but not mapped further.
©: Cloned gene
* Recombination probably reduced by heterozygosity for a translocation or inversion.
Meiotic linkage data for chromosome V
V contig list + cloned genes
Other maps
Gene lists
Maps home page

