A quantitative PCR approach to determine gene copy number
Peter S. Solomon, Simon V.S. Ipcho, James K. Hane, Kar-Chun Tan, Richard P. Oliver
Australian Centre for Necrotrophic Fungal Pathogens, SABC, Division of Health Sciences, Murdoch University, Perth 6150, WA, Australia.
Fungal Genetics Reports 55:5-8
Pdf
Here, we report on the use of quantitative PCR (qPCR) to determine gene copy number in filamentous fungi. Using the sequenced dothideomycete Stagonospora nodorum, qPCR was used to unequivocally confirm the presence of single, two and three copy regions as predicted by in silico PCR. Further validation of the technique was demonstrated by verifying the copy numbers of introduced gene cassettes in previously characterised transformants of S. nodorum. Apart from increased sensitivity, this technique offers a high-throughput alternative to Southern blots for determining gene copy number, a significant factor when screening fungal mutants and transformants.
Traditionally, Southern blots have been used to determine gene copy number (Southern, 1975). This typically involves extracting a significant quantity of genomic DNA, undergoing restriction digestions prior to blotting and probing. This is time consuming and often involves the use of 32P. Since its discovery, PCR has spawned a multitude of variations that have been accepted in many forms of biology and medicine. Among these is real time-PCR (RT-PCR) or quantitative PCR (qPCR). Technology advances in qPCR have realised its potential in many applications including allelic discrimination, gene expression, forensic science, analysis of chromosome aberrations and pathogen detection (Kubista et al., 2006). The cost associated with qPCR has now also made it accessible to many researchers throughout the world. This study examines the potential of using qPCR to replace the typical Southern blot process for determining gene copy number.
Stagonospora nodorum is a necrotrophic pathogen of wheat which is capable of inflicting significant economic losses (Solomon et al., 2006a). To develop a better understanding of mechanisms of pathogenicity, a reverse genetics approach is employed whereby a gene of interest can be targeted and selectively disrupted or deleted by transforming the fungus with a deletion construct. Ideally the construct only integrates into the genome once, at the homologous site. However, two or more integrations can occur leading to the possibility that the phenotype observed in the mutant may not be due to the disruption of the gene of interest, but to the ectopic integration(s) elsewhere in the genome.
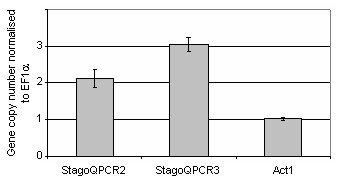
The validity of using qPCR to determine gene copy number was investigated by two different approaches. Firstly, the technique was applied to confirm known copy numbers of DNA regions within the S. nodorum genome uncovered from the genome assembly and annotation (Hane et al., 2007). To do this, the genome assembly of S. nodorum was screened for two and three copy high scoring pairs (HSP) of >95% identity and 300-1000bp length via blastn (Altschul et al., 1997), excluding those with undesirable sequence such as polyN tracts and short sequence repeats. These regions were subsequently named StagoQPCR2 and StagoQPCR3 for the two and three copy regions respectively. Primers were designed at sequence termini using Primer3 (Rozen and Skaletsky, 1999) (qPCR2f 5' GAACCATGTCATCCTCTCAGG 3'; qPCR2r 5' ACTTCGCCTTGACCTTAACC 3'; qPCR3f 5' ACGAGAGAGAGGCAAGATGC 3' and qPCR3r 5' GCGATTGTCTATCGTGTATTCC 3' ). Expected copy number was confirmed by in silico PCR (Schuler, 1997). Previously studied genes encoding γ-actin (Act1f 5' AGTCGAAGCGTGGTATCCT 3' and Act1r 5' ACTTGGGGTTGATGGGAG 3') and elongation factor 1α (EF1α f 5' CTCATCGTCGCCATCAAC 3' and EF1α r 5' TGTTGTCGCCGTTGAATC 3') were used to represent single copy regions within the genome (Solomon et al., 2006b; Solomon et al., 2006c). Genomic DNA from each of the strains was extracted using a Retsch MM301 autolyser and Qiagen BioSprint 15 and diluted to 6.7 ng μl-1, a concentration determined through template dilution experiments to provide optimal reaction efficiency for each of the primer combinations (data not shown). qPCR reactions were performed in technical triplicates and comprised of 5 μl of the diluted DNA, 5 μl of combined forward and reverse primers (1.2 μM) and 10 μl iSYBR qPCR mix (BioRad). The reactions were placed in a RotorGene 3000 (Corbett Research) and denatured at 95°C/3min followed by 40 cycles of 95°C/10s, 57°C/10s and 72°C/20sec. Fluorescence of the sample spectrum was acquired using 470 nm excitation filter and detected at 510 nm during each annealing stage. The relative concentration of the amplified DNA was calculated using the comparative quantification feature in the RotorGene 3000 software (http://www.corbettlifescience.com/). Briefly, the relative concentration is based on takeoff point and the reaction efficiency of each reaction and its comparison to a determined calibrator sample, which for this example, was simply S. nodorum SN15 at the above mentioned diluted concentration. The results in Figure 1 represent the copy numbers calculated for each of StagoQPCR2, StagoQPCR3 and Act1 normalised to the single copy EF1α. Subsequent melting curve analysis confirmed the absence of any non-specific amplification (data not shown). The copy numbers revealed for each of genes closely correlated to the known copies in the genome sequence, thus confirming the validity of the described qPCR technique to determine copy number.
Figure 1. A histogram representing the number of copies of each gene
normalised to that of the single copy gene EF1a. Standard deviation bars
are shown
A problem often encountered in our laboratory and many others is the screening of mutants after transformation to ensure that the transformed construct has only integrated once and at the right location. Integration at the homologous site can be confirmed by conventional PCR, designing primers either side of the insertion/deletion site and detecting the expected size shift on an agarose gel. However this does not exclude the possibility that the transformation construct has integrated elsewhere in the genome (ectopic integration). Traditionally Southern analysis has been used to determine this. For some fungal transformations, hundreds of transformants need to be screened to identify a suitable candidate (Balhadere et al., 1999). This is a slow process if based on Southern analysis and one which could greatly benefit from the development of a more high-throughput screening technique for single copy insertions.
To examine this, we applied the qPCR technique to mutants previously generated within this laboratory during the characterisation of mannitol metabolism in S. nodorum (Solomon et al., 2005; Solomon et al., 2006d). A series of deletion mutants lacking the mannitol dehydrogenase gene (Mdh1) and also the mannitol 1-phosphate dehydrogenase gene (Mpd1) were created by homologous recombination using gene disruption cassettes comprising of flanking DNA and phleomycin (Mdh1) or hygromycin (Mpd1) resistance genes. Strains lacking both Mdh1 and Mpd1, and consequently resistant to both phleomycin and hygromycin, were also developed. Whilst ideally each of these constructs would integrate once at the homologous site, occasionally integration does occur more than once resulting in multiple copies of the antibiotic resistance gene present in the target genome. In the Southern blot previously published, the restriction-enzyme digested genomic DNA was probed with either a specific labelled Mdh1 probe (Fig. 2A) or Mpd2 probe (Fig. 2B). In all strains examined during the development of the Mdh1 mutant, the construct integrated only once at the homologous site as indicated by the size shift. One of these strains, mdh1-71 was then transformed with a construct to disrupt the Mpd1 gene, thus creating a double mutant. Southern analysis of these strains revealed that in all but one strain, only a single integration of the disruption construct was present at the homologous site. However for the strain mpd1mdh1-51, Southern analysis revealed that, along with the homologous integration event, the strain contained other copies of the construct elsewhere in its genome.
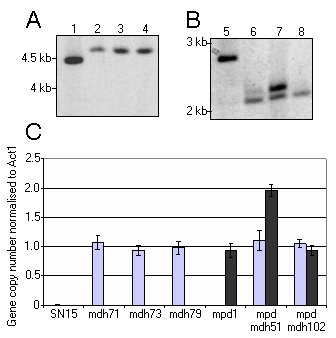
Figure 2. (A and B) Southern blots of strains S. nodorum SN15 (lane 1 and 5), mdh71 (lane 2), mdh73 (lane 3), mdh79 (lane 4), mpd1 (lane 6), mpdmdh51 (lane 7), mpdmdh102 (lane 8). The Southern shown in (A) was screened for a probe specific for Mdh1 whilst (B) was screened for Mpd1 (modified from (11)). (C) A histogram representing the copy number of either the phleomycin resistance gene (light grey) or hygromycin resistance gene (dark grey) in the strains used for the Southern analysis in (A) and (B). Panels (A) and (B) has been adapted from Solomon et al. (2006d).
These strains represent ideal tools to validate the qPCR gene copy technique to rapidly screen transformants. Primers were designed to either the phleomycin (PhleoF 5' ACTTCATCGCAGCTTGACTAAC 3' and PhleoR 5' TGATGAACAGGGTCACGTC 3') or hygromycin cassette (HygF 5' CGACGTCTGTCGAGAAGTTT 3' and HygR 5' TTGTAGAAACCATCGGCG 3'). These primers would be generic for any transformation construct, regardless of the actual target gene. Using the exact PCR conditions described above, the copy numbers of the hygromycin and phleomycin cassette were determined for each of the above strains (Fig. 2C). As expected, neither the hygromycin nor the phleomycin genes were detected in the wildtype S. nodorum strain SN15. For the phleomycin gene (representing Mdh1), a single copy was identified in each of strains that were resistant to the antibiotic in agreement with the Southern analysis. Similarly, the qPCR technique identified only a single copy of the hygromycin gene in the strains carrying this antibiotic resistant gene, with one exception. S. nodorum mpd1mdh1-51 was identified as carrying two hygromycin genes. Southern analysis of this strain supported this result with two clear bands apparent.
These results clearly demonstrate that the concept of determining gene copy number by quantitative PCR is valid. The advantages of qPCR over Southern analysis are evident. With both techniques, genomic DNA needs to be extracted, although in much greater quantities and superior quality for Southern analysis. For Southern analysis, the DNA then needs to be digested, blotted, probed and detected. This typically involves two overnight steps leading to a three-day process. For the qPCR technique, the extracted DNA is simply quantified, diluted and amplified in a quantitative reaction for around 70 min. Subsequent data analysis takes approximately 15 min and the copy number is determined. Furthermore, this technique eliminates the use radio-labelled nucleotides, typically required for probing eukaryotic genomes and can easily be applied to any biological system.
Acknowledgements
Rohan Lowe and Maryn Lord are acknowledged for their input and technical assistance during the course of this study. The Australian Grains Research and Development Corporation is acknowledged for its financial support of the Australian Centre for Necrotrophic Fungal Pathogens.
References
Altschul, S. F., T. L. Madden, A. A. Schäffer, J. Zhang, Z. Zhang, W. Miller, and D. J. Lipman (1997). Gapped BLAST and PSI-BLAST: a new generation of protein database search programs. Nucleic Acids Res 25: 3389-3402.
Balhadere, P. V., A. J. Foster, and N. J. Talbot (1999). Identification of pathogenicity mutants of the rice blast fungus Magnaporthe grisea by insertional mutagenesis. Mol. Plant Microbe Interact. 12: 129-142.
Hane, J., R. G. T. Lowe, P. S. Solomon, K.-C. Tan, C. Schoch, J. W. Spatafora, P. W. Crous, C. Kodira, B. Birren, and R. P. Oliver (2007). Dothideomycete-plant interaction illuminated by genome sequencing and EST analysis of the wheat pathogen Stagonospora nodorum. Plant Cell: (submitted).
Kubista, M., J. M. Andrade, M. Bengtsson, A. Forootan, J. Jonak, K. Lind, R. Sindelka, R. Sjoback, B. Sjogreen, L. Strombom, et al. (2006). The real-time polymerase chain reaction. Mol. Aspects Med. 27: 95-125.
Rozen, S., and H. Skaletsky (1999). Primer3 on the WWW for general users and for biologist programmers. In Methods in Molecular Biology, S. Misener, and S. A. Krawetz, eds. (NJ, Humana Press), pp. 365-386.
Schuler, G. D. (1997). Sequence mapping by electronic PCR. Genome research 7: 541-550.
Solomon, P. S., R. G. T. Lowe, K.-C. Tan, O. D. C. Waters, A. Bailey, and R. P. Oliver (2006a). Stagonospora nodorum; cause of Septoria nodorum blotch of wheat. Mol Plant Pathol 7: 147-156.
Solomon, P. S., R. G. T. Lowe, R. D. Trengove, J. Rechberger, and R. P. Oliver (2006b). Normalisation of metabolites in heterogenous systems using genomics. Anal. Biochem. 350: 156-158.
Solomon, P. S., K. Rybak, R. D. Trengove, and R. P. Oliver (2006c). Investigating the role of calcium/calmodulin- ependent protein signalling in Stagonospora nodorum. Mol. Microbiol. 62: 367-381.
Solomon, P. S., K.-C. Tan, and R. P. Oliver (2005). Mannitol 1-phosphate metabolism is required for sporulation in planta of the wheat pathogen Stagonospora nodorum. Mol. Plant Microbe Interact. 18: 110-115.
Solomon, P. S., O. D. C. Waters, C. I. Joergens, R. G. T. Lowe, J. Rechberger, R. D. Trengove, and R. P. Oliver (2006d). Mannitol is required for asexual sporulation in the wheat pathogen Stagonospora nodorum (glume blotch). Biochem. J. 399: 231-239.
Southern, E. M. (1975). Detection of specific sequences among DNA fragments separated by gel electrophoresis. J. Mol. Biol. 98: 503-517.