Phylogenic
analysis of
additional Neurospora crassa isolates
Tanja Radic, Silvia Gastaldello, Julia Diegmann and Till Roenneberg*
Institute for Medical Psychology, LMU, Goethestr. 31, 80336 Munich, Germany. * Corresponding author
Fungal Genetics Reports 59: 13 - 20
(pdf)
The ascomycete
Neurospora
crassa is classical model organisms in
biology. So far, a phylogenetic
analysis based on genomic sequences of four non-functional nuclear loci has been
reported for 44 natural isolates of N.
crassa. Three subgroups (clades) with a distinct geographical distribution
have been identified: clade A (Caribbean Basin and Ivory Coast), clade B
(Europe, Ivory Coast and India), and clade C (India). Here, we report the
results of a phylogenetic analysis of 16 additional isolates. Six of these were
from the Caribbean Basin, eight from Europe and one from Pakistan and one from
Thailand. The previously described clades and their geographical distribution
were generally confirmed. All Caribbean isolates belonged to clade A and all
European isolates belonged to clade B, with the exception of one isolate from
Italy, which also belonged to clade A, suggesting a transport from the Caribbean Basin or the Ivory Coast to Europe.
Interestingly,
the isolates from
Pakistan
and Thailand were found in a
separate group, basal to all other clades. Their phylogenetic classification is
not yet clear as they might belong to N. crassa but as well to N.
perkinsii, potentially representing yet undescribed phylogenetic groups or
species of Neurospora, or hybrids.
Introduction
The filamentous ascomycete Neurospora
comprises about 35 species (Nygren et al.,
2011). One of the Neurospora species,
Neurospora
crassa, gained a special status as model organism for genetic,
cytogenetic, biochemical, molecular and population biology studies (Perkins,
1992) because of its favorable characteristics, such as a haploid life cycle,
fast growth and reproduction, rather large spores, and because of its sequenced
genome (Galagan et al., 2003). Furthermore,
it became a valuable model for studying the molecular mechanisms of
the circadian clock (Merrow et al.,
2001). Most of the knowledge about the clock came from studying mutant
N. crassa strains (Bell-Pedersen,
2000). However, the response characteristics of the clock under natural
conditions have so far received little attention (Michael
et al., 2007). Therefore, we became interested in possible
differences in the circadian system according to the geographical distribution
of wild N. crassa isolates. Since, the
phylogenetic relationship of several isolates was not known but appeared
important for the interpretation of our physiological results, the aim of this
study is to clarify this matter.
To date, the
phylogenetic relationship of 188 isolates from
eight
phylogenetic species has been studied (Villalta
et al., 2009) using the phylogenetic species recognition (PSR) method, which
is based on the
genealogical concordance of DNA sequence of
four polymorphic loci
(Dettman et al., 2003a). Within
N. crassa, the
isolates (N = 44) were shown to belong to three subgroups, named clade A, B and
C, which are not recognized as phylogenetic species because their evolutionary
lineages were not identified as independent (Dettman
et al., 2003a).
Clade A is found predominantly in the
Caribbean Basin and the Ivory Coast, clade B in Europe, western North America,
southern India and the Ivory Coast, and clade C exclusively in Tamil Nadu, India
(Jacobson et
al., 2006). Since clade C is nearest
to the root of the phylogenetic tree, Turner
et al. (2010) hypothesized
that
N. crassa migrated from India to Africa and to the Caribbean Basin.
In this paper,
we assess how the 16 additional isolates, which were classified as N. crassa by
the Fungal Genetic Stock Center, fit into the existing phylogenetic framework.
They were mainly from Europe but to represent a wider geographical range we also
chose isolates from the Caribbean Basin, Thailand, and Pakistan. We found that
our European isolates belong to clade B, with the exception of one Italian
isolate that belongs to clade A. Our Caribbean isolates belong to clade A, while
the isolates from Thailand and Pakistan could not be placed in any of the known
clades.
|
FGSC
number |
Collection site |
Mating
type |
|
1825 |
Pakistan, Lahore |
a |
|
3693 |
Puerto
Rico, Colonia Paraiso |
A |
|
4705 |
Brazil,
Rondon |
A |
|
5914 |
Guyana,
Torani Canal |
A |
|
6211 |
Costa
Rica, Jaco |
A |
|
6233 |
Venezuela, Puerto Ayacucho |
a |
|
6797 |
Thailand, Khao Eto |
A |
|
7553 |
French
Guiana, Devils Island-Ile St. Joseph |
a |
|
10860 |
Spain,
Seros |
A |
|
10861 |
Spain,
Seros |
a |
|
10862 |
Spain,
Seros |
a |
|
10863 |
Spain,
Seros |
A |
|
10864 |
Spain,
Seros |
A |
|
10865 |
Spain,
Seros |
a |
|
10866 |
Italy,
Genova |
a |
|
10867 |
Scotland
UK, Edinburgh |
A |
All isolates
were kept in slants with Vogel’s Minimal Medium containing 2% glucose, 1X
Vogel’s salts (Vogel, 1956) and 2% agar at room temperature (slants plugged with
cotton stoppers). They were inoculated from the original stocks on the day of
arrival, and then allowed to grow on the bench for seven days before using or
being wrapped with Parafilm (Pechiney Plastic Packaging, Menasha, WI) for
long-term storage. For storage, all isolates were preserved at -20°C. To avoid
the accumulation of background mutations, we refrained from making further
subcultures of these stocks.
Isolates were
grown in 100 ml Erlenmeyer flasks with medium, containing 20 ml 50X Vogels’ salt
(Vogel, 1956), 5 g arginine, 100
ml biotin, 20 g
glucose, and 500 ml H2O, for 2–3 days at room temperature in an
orbital shaker under constant white light (4 µE m-2 sec-1).
Mycelial tissue was dried between paper tissues, submerged in liquid nitrogen
and ground to powder. Dry tissue was incubated at 65°C for 1 h in 600 µl of
lysis buffer with final concentrations of 100 mM Tris-HCl, 50 mM EDTA, 1% SDS,
and 20 mg/ml Proteinase K (BioLabs, Frankfurt, Germany). 7.5 M ammonium acetate
was added and samples were centrifuged at 13 800 rpm on 4°C for 3 min. The
supernatant was incubated with RNase A (10 mg/ml, Roche Diagnostics, Mannheim, Germany) for 1 h at
37°C. After a wash with chloroform-isoamyl alcohol (24:1), samples were
centrifuged (13 800 rpm for 8 min) to remove cellular debris. The aqueous phase
was collected and genomic DNA was extracted using isopropanol by centrifuging at
13 800 rpm for 30 min at 4°C. The pellet containing genomic DNA was washed with
70% ethanol, dried and dissolved in water.
All primer sequences (TMI, DMG, TML, and QMA) were same as
in Dettman et al. (2003a). The
following PCR reaction conditions were used: 10 mM dNTPs (Qiagen, Hilden,
Germany), 5 pmol/µl of each primer (Metabion, Planegg/Martinsried, Germany), 10
X Qiagen PCR Buffer, 5 X Qiagen Q-Solution, 25 mM MgCl2, 5 U/ml Taq
DNA Polymerase (Qiagen, Hilden, Germany). The thermal cycler protocol for
markers was as follows: initial denaturation at 94°C for 2 min; 35 cycles of
94°C for 1 min together with marker-specific annealing temperature for 30 sec
(see Dettman et al., 2003a) and
extension at 72°C for 1 min; 8 min final extension at 72°C; maintenance at 4°C.
Finally, amplification products were purified from the gel using QIAquick Gel
Extraction Kit (Qiagen, Hilden, Germany) according to the manufacture’s protocol
and then used for sequencing.
Sequencing
reactions were performed using Big Dye Terminator BDu3 chemistry (Applied
Biosystems, Darmstadt, Germany) and the following conditions: 1.3 µl of 1 M
sequencing primers (Metabion, Planegg/Martinsried, Germany), 2 µl of 5 X
Sequencing Buffer (Applied Biosystems, Darmstadt, Germany), 1 µl of Big Dye
(Applied Biosystems, Darmstadt, Germany), 2.7 µl of the amplified product, and 3
µl of water. The PCR program was as follows: initial denaturation at 96°C for 1
min; 25 cycles of 96°C for 10 sec together with annealing at 50°C for 5 sec and
extension at 60°C for 4 min; hold at 4°C. PCR products were purified from dye
terminator nucleotides, primers, excess salts, and other contaminants from
sequencing reactions with Sephadex G-50 (Sigma-Aldrich, Steinheim, Germany). The
plate was filled with Sephadex and 300 µl H2O and left for 2 h at
room temperature. The excess water was removed by centrifuging on 6000 rpm for 4
min. The columns were washed with water and sequencing reactions were added.
After centrifuging the plate on 6000 rpm for 4 min the cleaned sequencing
reactions were collected. Formamide was added to reactions and left at 95°C for
5 min. Sequencing reactions were run on a DNA Sequencer 3100 (Applied Biosystems,
Foster City, CA, USA). Finally, the sequence data were examined and edited
visually using Sequencher 4.7 (Gene Codes, Ann Arbor, MI, USA). Nucleotide
sequences have been deposited in GenBank under the accession numbers
JQ629968–JQ630031.
DNA sequences
were aligned using MacClade 4.06 (Maddison and Maddison, 2000). The gaps were treated as missing data and the regions of sequence with
ambiguous alignment and microsatellite repeats were excluded as in Dettman
et al. (2003a). Sequence data from TMI, DMG, TML and QMA loci were aligned in one file
and added to
the alignment file provided by Villalta et
al. (2009). However, to simplify the analysis, a total of 67
Neurospora isolates contributed to the present phylogenetic analysis
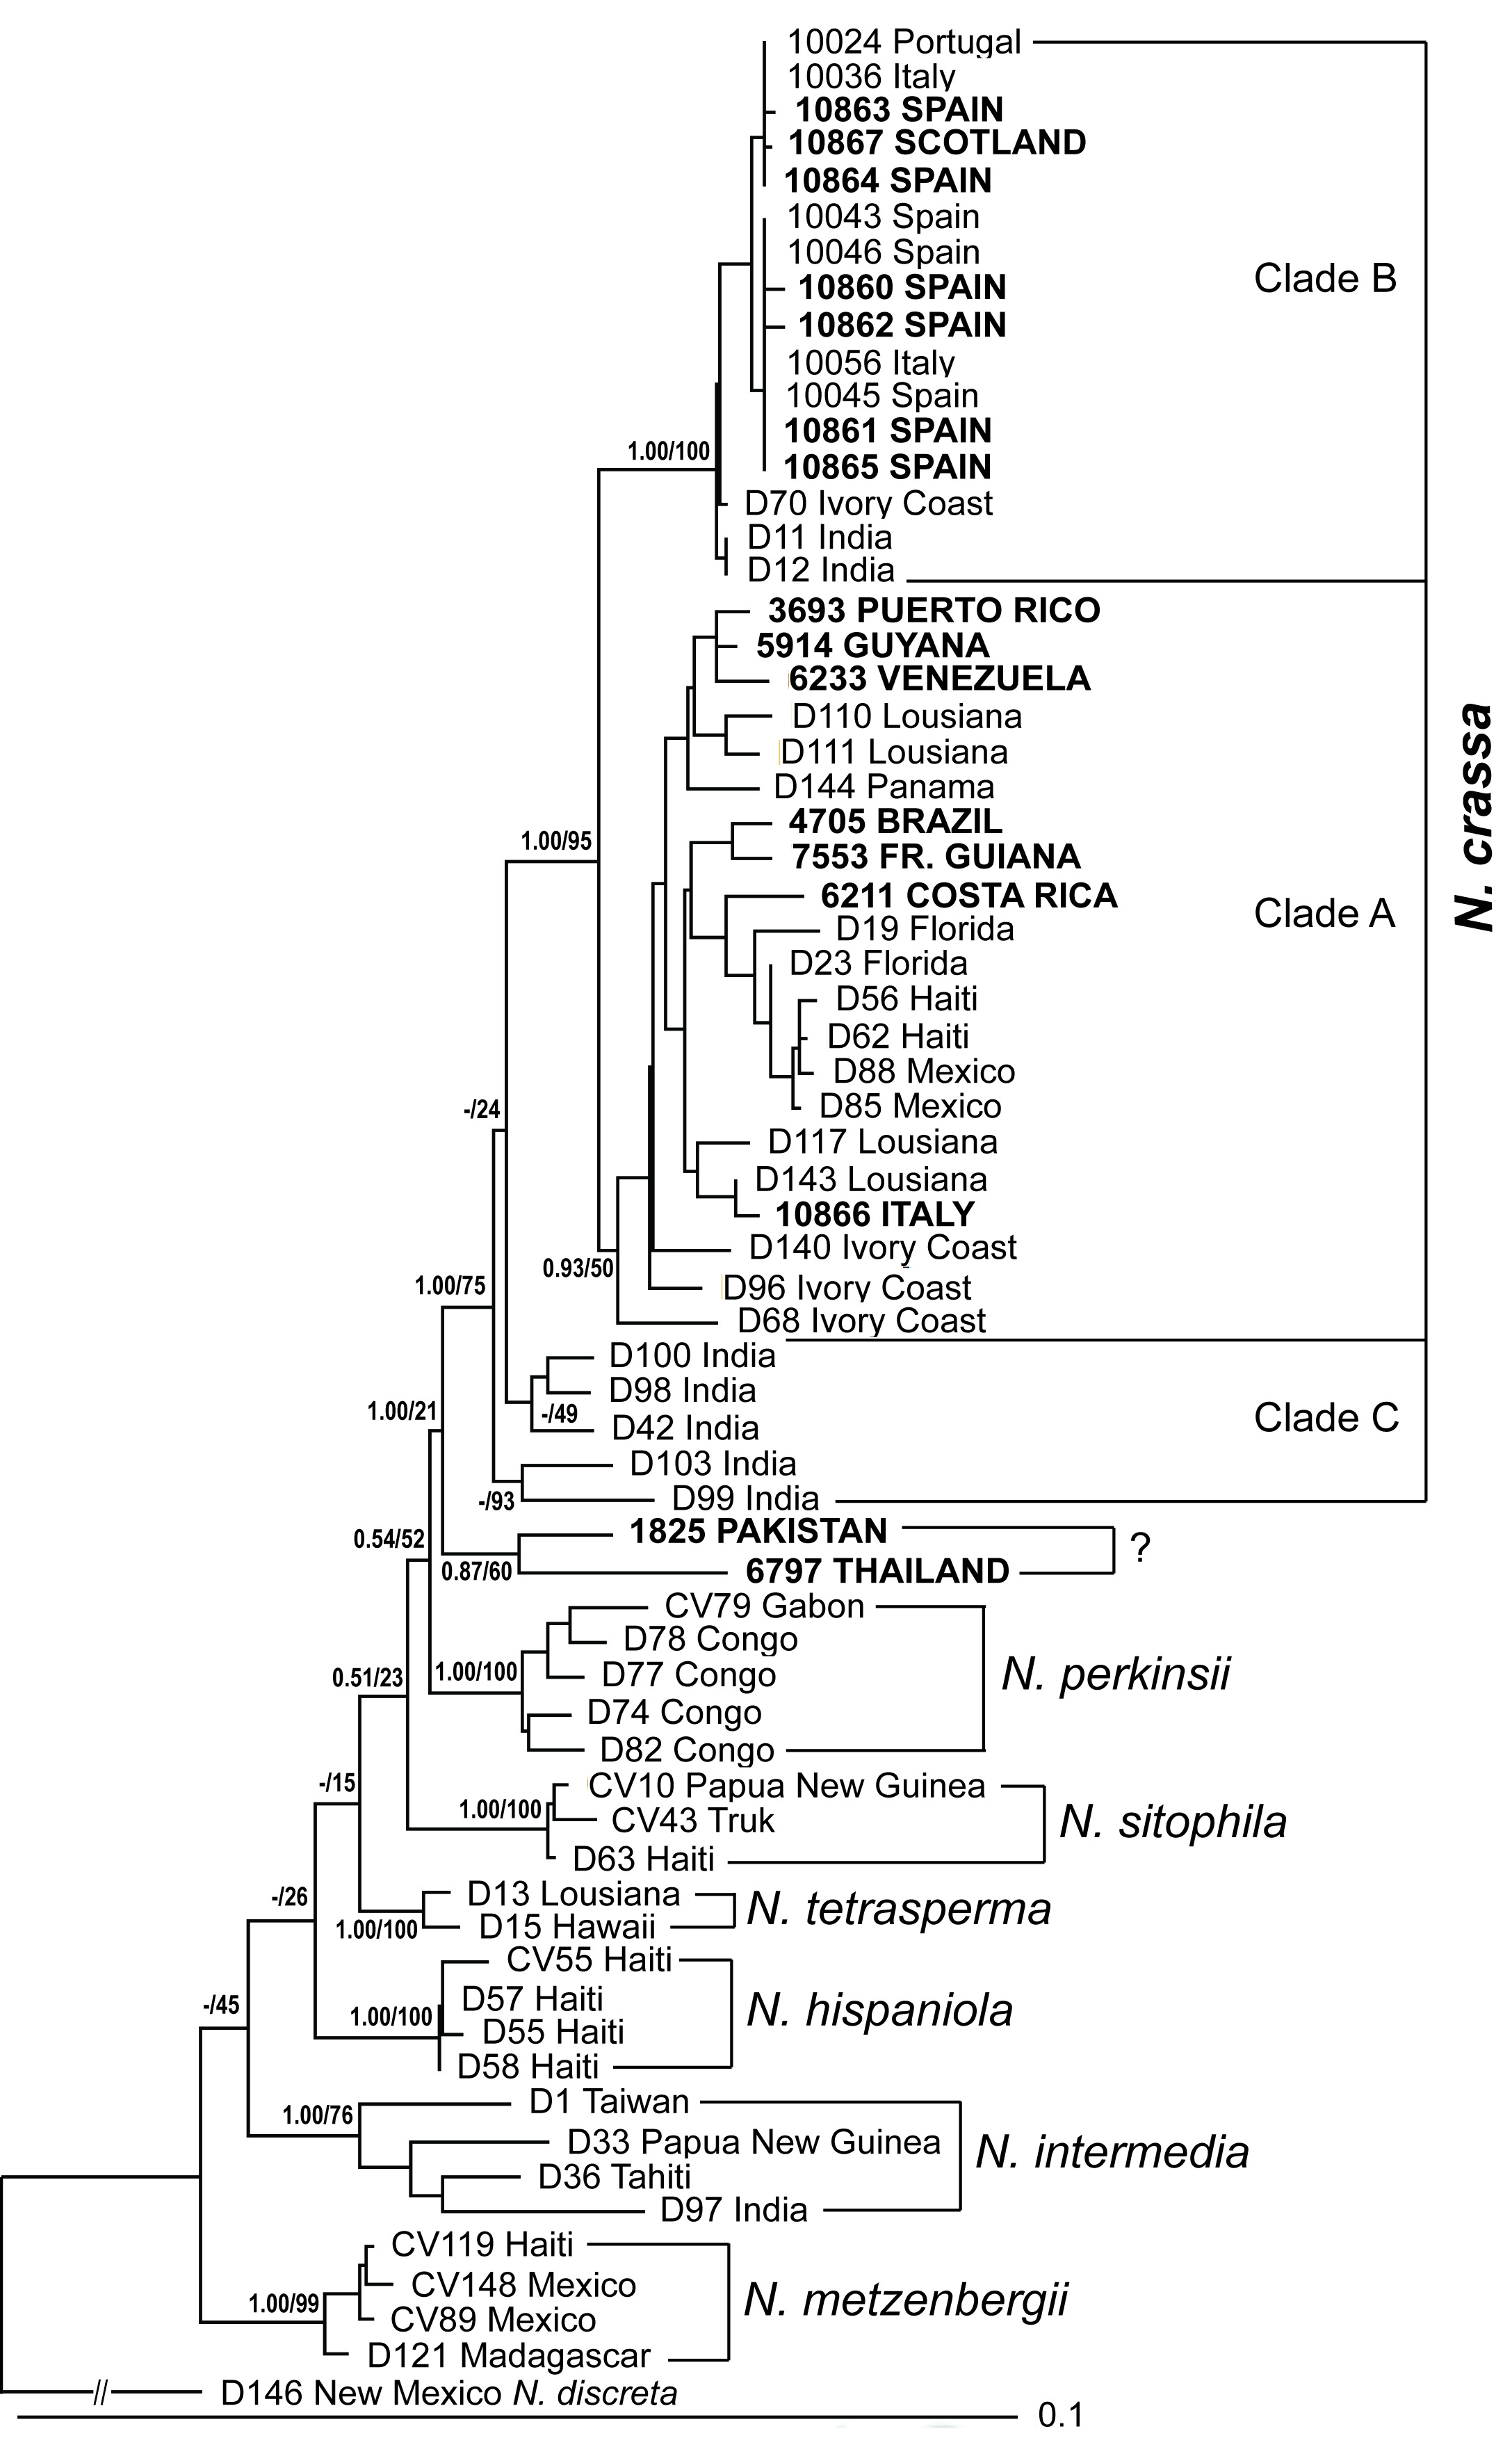
(see Figure 1).
The appropriate nucleotide substitution model was chosen using Modeltest 3.7 (Posada and Crandall, 1998) and PAUP
4.0b10 (Swofford, 1998). The
alignment and the chosen nucleotide substitution model were used as input for
MrBayes
(Huelsenbeck et
al., 2001; Ronquist and Huelsenbeck, 2003). The analysis was run
for 1 million
generations with burn-in of 2 500 generations to produce a consensus tree with
Bayesian posterior probabilities. The final tree (Figure 1) and
bootstrap branch support values were obtained with RAxML v7.2.8 (Stamatakis,
2006; Stamatakis et al., 2008) using
the maximum likelihood option with gamma model for 100 replicates and with
N. discreta as outgroup. The full alignment containing all four loci has
been deposited in TREEBASE under the
http://purl.org/phylo/treebase/
phylows/study/TB2:S12564.
The
sequencing of the four independent nuclear loci (TMI, DMG, TML and QMA), which
have previously been used in several studies for phylogenetic species
recognition (e.g. N. crassa: Dettman
et al., 2003a;
N. discreta: Dettman et al.,
2006; N. tetrasperma: Menkis
et al., 2009), resulted in
approximately 2 000 nucleotides of sequence data for each of the 16 newly
sampled isolates. The maximum likelihood consensus tree based on the
concatenated sequence data from the four loci had Bayesian posterior
probabilities (PP) between 0.51 and 1.00, and maximum likelihood bootstrap
proportions (MLBP) between 15% and 100%. The tree confirmed the phylogenetic
species of Neurospora and
was similar to those provided by Dettman
et al. (2003a) and Villalta et
al. (2009).
The
geographical distribution of the known N.
crassa clades was also confirmed (Dettman
et al., 2003a). The
six isolates from the Caribbean
Basin (Costa Rica, Venezuela, Puerto Rico, Guyana, Brazil and Fr. Guiana) and
one European isolate (from Italy) belong to clade A; the other seven European
isolates (from Scotland and Spain) to clade B. The branch support values for
clades A and B were equally high (Bayesian PP / MLBP = 0.93/50% and 1.00/100%,
respectively). For then Indian isolates (clade C), the values were 1.00/75%
compared to 1.00/95% of clade A and B combined (Figure 1).
One isolate
from Europe (10866 Italy), however associated with clade A (predominantly
representing isolates from the Caribbean Basin and the Ivory Coast; Jacobson
et al., 2006). An explanation for this
exception may be that isolate 10866 was at some time in history transported from
the Caribbean Basin or Ivory Coast to Europe (e.g., by human trade). After all,
Neurospora
crassa
has frequently been found
in
bakeries (Yassin and Wheals, 1992).
Two isolates
(from Pakistan and Thailand) did not fall into any of the existing
N. crassa clades and were found to be
separate and basal to all other clades. Thus, their phylogenetic relationship
cannot as yet be clearly classified as N.
crassa or N. perkinsii. Two facts
make the classification of these two isolates as
N. crassa likely. Based on crosses, they have been grouped by Fungal
Genetic Stock Center to N. crassa
(Perkins et al., 1976; Perkins and
Turner, 1988) and their geographical collection sites are close to those
N. crassa isolates that fall into
clade C. On the other hand, their bootstrap values indicate a closed
relationship to N. perkinsii than to
N. crassa (21% vs 75%, respectively).
Thus, these two isolates may potentially represent yet undescribed phylogenetic
groups or species of Neurospora, or
hybrids. To clarify their classification unambiguously, comprehensive mating
tests (Dettman et al., 2003b) and
phylogenetic analyses of more individuals from this region will be necessary.
Acknowledgements
We thank David
J. Jacobson and John W. Taylor for suggestions regarding the analysis, Hans
Distel and Manfred Goedel for discussion, and Ryan Oyama and Susanne Renner for
giving us the opportunity to use their Sequencer. Funding for this research was
provided by the Bayerische Eliteförderung.
References
Bell-Pedersen, D. 2000. Understanding circadian rhythmicity in
Neurospora crassa: from behavior to
genes and back again. Fungal Genet. Biol. 29:1–18.
Dettman, J.R., Jacobson, D.J., and Taylor, J.W. 2003a. A
multilocus genealogical approach to phylogenetic species recognition in the
model eukaryote Neurospora. Evolution
57:2703–2720.
Dettman, J.R., Jacobson, D.J., Turner, E., Pringle, A., and
Taylor, J.W. 2003b. Reproductive isolation and phylogenetic divergence in
Neurospora: comparing methods of
species recognition in a model eukaryote. Evolution 57:2721–2741.
Dettman, J.R,
Jacobson, D.J., and Taylor, J.W. 2006.
Multilocus sequence data reveal
extensive phylogenetic species diversity within the
Neurospora discreta complex.
Mycologia 98:436–46.
Galagan, J.E., Calvo, S.E., Borkovich, K.A., Selker, E.U.,
Read, N.D., Jaffe, D., FitzHugh, W., Ma, L.J., Smirnov, S., Purcell, S., Rehman,
B., Elkins, T., Engels, R., Wang, S., Nielsen, C.B., Butler, J., Endrizzi, M.,
Qui, D., Ianakiev, P., Bell-Pedersen, D., Nelson, M.A., Werner-Washburne, M.,
Selitrennikoff, C.P., Kinsey, J.A., Braun, E.L., Zelter, A., Schulte, U., Kothe,
G.O., Jedd, G., Mewes, W., Staben, C., Marcotte, E., Greenberg, D., Roy, A.,
Foley, K., Naylor, J., Stange-Thomann, N., Barrett, R., Gnerre, S., Kamal, M.,
Kamvysselis, M., Mauceli, E., Bielke, C., Rudd, S., Frishman, D., Krystofova,
S., Rasmussen, C., Metzenberg, R.L., Perkins, D.D., Kroken, S., Cogoni, C.,
Macino, G., Catcheside, D., Li, W., Pratt, R.J., Osmani, S.A., DeSouza, C.P.,
Glass, L., Orbach, M.J., Berglund, J.A., Voelker, R., Yarden, O., Plamann, M.,
Seiler, S., Dunlap, J., Radford, A., Aramayo, R., Natvig, D.O., Alex, L.A.,
Mannhaupt, G., Ebbole, D.J., Freitag, M., Paulsen, I., Sachs, M.S., Lander,
E.S., Nusbaum, C., and Birren, B. 2003. The genome sequence of the filamentous
fungus Neurospora crassa. Nature
422:859–868.
Huelsenbeck, J.P., Ronquist, F., Nielsen, R., and Bollback,
J.P. 2001. Bayesian inference of phylogeny and its impact on evolutionary
biology. Science 294:2310–2314.
Jacobson, D.J., Dettman, J.R., Adams, R.I., Boesl, C.,
Sultana, S., Roenneberg, T., Merrow, M., Duarte, M., Marques, I., Ushakova, A.,
Carneiro, P., Videira, A., Navarro-Sampedro, L., Olmedo, M., Corrochano, L.M.,
and Taylor, J.W. 2006. New findings of
Neurospora in Europe and comparisons of diversity in temperate climates on
continental scales. Mycologia 98:550–559.
Maddison, D.R., and Maddison, W.P. 2000. MacClade 4:
Analysis of phylogeny and character evolution. Version 4.0. Sinauer
Associates, Sunderland, Massachusetts.
Menkis, A., Bastiaans,
E. Jacobson, D.J., and Johannesson, H. 2009.
Phylogenetic and biological species
diversity within the Neurospora
tetrasperma complex. J. Evol. Biol.
22:1923–36.
Michael, T.P., Park, S., Kim, T.S., Booth, J., Byer, A., Sun,
Q., Chory, J., and Lee, K. 2007. Simple sequence repeats provide a substrate for
phenotypic variation in the Neurospora
crassa circadian clock. PLoS One 2:e795.
Merrow, M., Roenneberg, T., Macino, G., and Franchi, L. 2001.
A fungus among us: the Neurospora crassa
circadian system. Semin. Cell Dev. Biol. 12:279–285.
Nygren, K., Strandberg, R., Wallberg, A., Nabholz, B.,
Gustafsson, T., Garcia, D., Cano, J., Guarro, J., and Johannesson, H. 2011. A
comprehensive phylogeny of Neurospora
reveals a link between reproductive mode and molecular evolution in fungi. Mol.
Phylogenet. Evol. 59:649–663.
Perkins, D.D. 1992.
Neurospora: the organism behind
the molecular revolution. Genetics 130:687–701.
Perkins, D.D., and Turner, B.C. 1988.
Neurospora from natural populations:
toward the population biology of a haploid eukaryote. Exp. Mycology 12:91–131.
Perkins, D.D., Turner, B.C., and Barry, E.G. 1976. Strains of
Neurospora collected from nature.
Evolution 30:281–313.
Posada, D., and Crandall, K.A. 1998. MODELTEST: testing the
model of DNA substitution. Bioinformatics 14:817–818.
Ronquist, F., and Huelsenbeck, J.P. 2003. MRBAYES 3: Bayesian
phylogenetic inference under mixed models. Bioinformatics 19:1572–1574.
Stamatakis, A. 2006. RAxML-VI-HPC: maximum likelihood-based
phylogenetic analyses with thousands of taxa and mixed models. Bioinformatics
22:2688–2690.
Stamatakis, A., Hoover, P., and Rougemont, J. 2008. A rapid
bootstrap algorithm for the RAxML Web servers. Syst. Biol. 57:758–771.
Swofford, D.L. 1998. PAUP*. Phylogenetic Analysis Using
Parsimony (*and Other Methods). Version 4. Sinauer Associates, Sunderland,
Massachusetts.
Turner, E., Jacobson, D.J., and Taylor, J.W. 2010. Reinforced
postmating reproductive isolation barriers in
Neurospora, an Ascomycete
microfungus. J. Evol. Biol. 23:1642–1656.
Villalta, C.F., Jacobson, D.J., and Taylor, J.W. 2009. Three
new phylogenetic and biological Neurospora
species: N. hispaniola, N. metzenbergii
and N. perkinsii. Mycologia
101:777–789.
Vogel, H.J. 1956. A convenient growth medium for
Neurospora (Medium N). Microb. Genet.
Bull. 13:42–43.
Yassin, S., and Wheals, A. 1992.
Neurospora species in bakeries. J. Appl. Bacteriol. 72:377–380.