B. T. Hawthorne1, J. Rees-George1, J. Bowen1 and R. D. Ball2- 1Molecular Genetics Group, The Horticulture and Food Research Institute of New Zealand Ltd., Auckland, New Zealand; 2Forestry Research Institute, Rotorua, New Zealand.
Analysis of the pathogenicity of 800 progeny from a HI-path (Blue) x LO-path (Cream) cross showed that the quantitative genetic control of pathogenicity in Nectria haematococca MPI on hypocotyls of Cucurbita maxima was determined by 6-12 ‘effective factor’ or quantitative trait loci (QTL). In addition there was evidence for a virulence/colony colour gene(s) with an effect that was superimposed on the pathogenicity phenotype.
Pathogenicity is a polygenically controlled character in Nectria haematococca MPI (Fusarium solani f.sp cucurbitae, race 1) (Hawthorne et al. 1994 Mycol. Res. 98: 1183-1191). To gain a more precise understanding of the quantitative control of pathogenicity in strains of F. solani which attack cucurbits we studied 800 progeny from a cross between two strains selected for very high and very low pathogenicity, respectively, on detached hypocotyls of Cucurbita maxima. The two parental strains had similar morphology and growth rates on culture media but they differed in the colour of their colonies. The HI-path parent was blue and the LO-path parent was cream in colour (Figure 1).

Figure 1. Pedigree of progeny from a cross between a high pathogenicity strain and a low pathogenicity strain. Strain 10.2.5 designates ascospore #5 from ascus #2 in cross #10 and 26R22 designates a randomly isolated ascospore from cross #26.
Random ascospore progeny from perithecia producing spore horns were allowed to germinate for
16 h on water agar and over 800 viable spores were isolated onto PDA in individual wells in 24-well tissue culture plates. Stock cultures of each progeny were held as dried cultures on filter paper at 20 C (Valent et al. 1986 Iowa State J. of Res. 60:569-594.). The 800 progeny were screened for pathogenicity in a series of 12 separate tests involving approximately 50 progeny and the two parents in each test using previously described methods (Hawthorne et. al. 1994 ibid). In each test the length and width of lesions on 10 unwounded, detached hypocotyls of C. maxima was measured for each progeny and parental strain. Colony color was recorded for each progeny. The variable used in analysis was square root of lesion area. Means for individual progeny were calculated after using the parental means to correct for test effects. Genetic variances ( 2G) were estimated separately for each test and the between test variation used to give an estimate of standard error for the variance estimates. These quantities were then used as previously to estimate (using either parental means or progeny extremes) the number of ‘effective factors’ influencing the pathogenicity phenotype (Hawthorne et al. 1994 ibid).
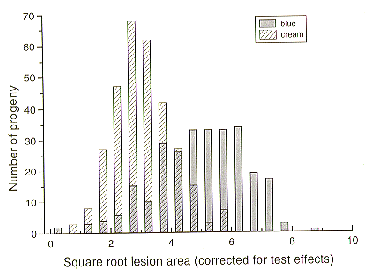
There were 360 Blue progeny and 426 Cream progeny, a segregation ratio of approximately one. There was no difference in growth and sporulation of the two parents and blue and cream progeny cultured on both minimal and complete media at temperatures from 10 to 25 C. Blue colored progeny, as a group, were more virulent than the cream coloured progeny. However, the distribution of progeny means for lesion size was wide, and overlapped, for the two colony color populations (Figure 2). The wide distribution of lesion size reflects a quantitatively determined character. Mather’s (1949 Biometrical Genetics. Methuen) formula
 was used to estimate of the number of ‘effective factors’, k,
influencing lesion size in this cross. Using the progeny extremes, uA = 8.55
(sem = 0.32) and uB = 0.35 (sem = 0.41) and 2G = 1.83 (se = 0.23) the estimate
of k was 9.2 (95% ci, 6.21-12.66). One of the factors affecting
virulence appeared to exert a greater effect than the rest and is evidently
linked to a gene controlling colony color or is the color gene itself. This
conclusion is supported by an effective factors calculation using parental
means which suggests that a single gene/locus had a major effect on virulence
in this cross (Table 1).
We are presently identifying markers linked to the virulence gene using bulk segregant DNA from the 10 highest and lowest pathogenicity progeny from the cross. These will subsequently be used in map-based cloning of the virulence gene in conjunction with an artificial chromosome library.
Acknowledgement
This research was supported by the New Zealand Foundation for Research Science and Technology (CO6402).
Table 1. Estimates, using parental means, of ‘effective factors’ influencing
virulence1
  Test #   HI-path parent   LO-path parent     Genetic      Effective
               mean uA          mean uB       variance      factors k
                                                 2G
1               4.24             1.77           3.87           .39
2               4.43             1.93           1.12          1.40
3               4.64             2.09           2.47          0.66
5               5.03             2.40           1.23          1.40
6               5.22             2.56           1.45          1.22
7               5.42             2.72           1.59          1.14
8               5.62             2.88           1.11          1.69
9               5.81             3.30           2.63          0.73
10              6.01             3.19           1.62          1.23
12              6.40             3.50           1.31          1.60
13              6.60             3.66           1.57          1.38
14              6.80             3.81           2.08          1.07
MEANS           5.52             2.80           1.83          1.16
                                             (sem=0.23)    (sem=0.19)
1 The number of effective factors were calculated according to the formula,


Figure 2. Classification of progeny from Cross #38
Return to the FGN 44 Table of Contents