Wei Li1, Leonard F. Yourman1, Sally A. Leong1,2, Russell N. Spear1, and John H.Andrews1- 1Department of Plant Pathology; 2Plant Disease Resistance Research Unit, USDA, University of Wisconsin, 1630 Linden Drive, Madison, WI 53706
Aureobasidium pullulans was transformed with genes encoding ß-glucuronidase (gusA) and GUS expression was assayed fluorometrically. We found that GUS activity in intact, permeabilized fungal cells very closely approximated the sum of the GUS activity in cell-free extracts and pellet fractions. Our results suggest that GUS can be monitored quickly, simply, and quantitatively in intact cells of A. pullulans, and perhaps other fungi, without the need for homogenization.
Since the ß-glucuronidase gene (gusA) was first isolated from Escherichia coli (Jefferson 1987 Plant Mol. Biol. Rep. 5:387-405), the GUS assay has become a widely used reporter system in the study of bacteria, animals, plants and, more recently, in yeasts and filamentous fungi. This is mainly because of enzyme stability and the high sensitivity and amenability of the assay to detection by fluorometric, spectrophotometric, or histochemical techniques. In general, the former two assays are conducted in vitro, the latter in situ. The experimental material for in vitro assays has been intact, permeabilized cells, as in the case of bacteria and certain animal cells (Gallagher 1992 Gus Protocols, Academic Press). For plants and fungi, however, generally cell-free extracts have been used (Gallagher 1992). Typically, lysis has been achieved by grinding cells or tissues with or without abrasives such as ground glass or sand (Roberts et al. 1989 Curr. Genet. 15:177-180; Bauer et al. 1993 Yeast 9:71-75). This is a time- consuming process and can be a source of error in experiments.
Homogenization is necessary when GUS activity is expressed per unit protein, for which proteins must be released from cells for accurate assay. In some systems, however, GUS activity could be standardized relative to other criteria such as cell (spore) number. In such cases, mechanical disruption would not be necessary, assuming that the enzyme could still interact with the substrate and the product assayed. Our objective was to determine if GUS assays could be conducted with intact rather than homogenized fungal spores. We report that GUS activity in the yeast- like fungus Aureobasidium pullulans can be quantified fluorometrically in permeabilized, intact cells (blastospores).
We cotransformed A. pullulans strain Y- 117 with the GUS gene using plasmid pNOM102 containing gusA, and the hygromycin resistance gene (as a selectable marker) using either plasmid pDH33 or pAN7-2, both containing hygB (Wang et al. 1988 Proc. Natl. Acad. Sci. USA 85:865-869). The gusA and hygB genes in pNOM102 and pAN7-2, respectively, are under the control of glyceraldehyde-3-phosphate dehydrogenase promoter from Aspergillus nidulans (Roberts et al. 1989). The hygB gene in pDH33 is driven by the glucoamylase promoter from Aspergillus niger (Smith et al. 1990 Gene 88:259-262). No difference in transformation efficiency or hygromycin resistance was detected between transformants containing pDH33 or pAN7-2. Three different transformants, B3, B5, and B6 were used in this study. Transformant B3 received plasmids pDH33 and pNOM102, while B5 and B6 were transformed with pAN7-2 and pNOM102.
The growth conditions for both wild-type and transformed cultures have been described elsewhere (Andrews et al.1994 Can. J. Microbiol. 40:6-17). In brief, the composition of the medium (in g/L H2O) was basal mineral salts, KH2PO4 (1.0), K2HPO4 (1.0) and MgSO4 (0.5). The nitrogen source was (NH4)2SO4 (0.73); the carbon source was glucose (1.0). At harvest at mid- log phase, ca. 1x10⁷ blastospores/ml culture, as determined by hemacytometer count, were concentrated by centrifugation at 9,800 x g for 10 min at 4oC. The pellet was washed twice with Type I water (E- PureTM; Barnstead, Dubuque, Iowa), and resuspended in extraction buffer (50 mM sodium phosphate buffer, pH 7.0; 10 mM ß- mercaptoethanol; 10 mM Na2EDTA; 0.1% sodium lauryl sarcosine; 0.1% Triton X- 100)(Jefferson 1987 ibid). For the intact cell assay, spores were diluted to give 1x10⁴ spores in 500 ul. For the homogenization assay, different methods were tested to achieve thorough and efficient grinding. Maceration with finely ground glass in a vortex mixer gave >85% cell disruption, but required lengthy disruption (>10 min). We later used alumina powder (aluminum oxide, Sigma, St. Louis, Missouri) for homogenizing cells in a microcentrifuge tube fitted with a disposable pestle (Fisher Scientific, Chicago, IL). Alumina suspension (20 ul of 1.19 g/ml of alumina powder in extraction buffer) was added to 1x10⁴ spores in 30 ul extraction buffer and ground mechanically until inspection by microscopy showed that virtually all cells were disrupted (3 min). Cell- free extracts were separated from pellets by centrifugation at 13,800 x g for 5 min at room temperature. In some experiments, the pellet was processed further by washing twice with 50 ul extraction buffer, after which it was assayed again for GUS activity. We also tested separating extract from debris by passage through a spin column of Sephadex G-25.
GUS assays were conducted so that the various preparations (intact cells, cell- free homogenate, cell- free extract, pellet) were incubated concurrently in replicates of five with the fluorometric substrate MUG (4- methylumbelliferyl ß-D-Glucuronide,Research Organics Inc., Cleveland, Ohio) (Jefferson 1987 ibid). The final concentration of the substrate was 1.6 mM except in preliminary enzyme kinetics experiments where substrate concentration was varied from 0 to 1.8 mM (see below). After we incubated the reaction mixture at 37oC for 0 (control), 120, and 180 min, 50 ul samples were removed, mixed with 1.95 ml stop buffer (0.2 M Na2CO3), and the fluorescence measured on a Schimadzu RF-Mini 150 Fluorometer (Schimadzu; Columbia, MD) with MU (4-methylumbelliferone,Sigma) as the standard. The wavelengths of the filters were fixed at 360 and 460 nm for excitation and emission, respectively. Depression of fluorescence by the alumina powder was corrected for by extrapolating from a standard curve based on titration of the MU standard with and without 20 ul alumina suspension added.
The linearity of GUS activity with time was checked under our specific assay conditions for intact cells (data not shown). Proper substrate concentration was calculated from Lineweaver- Burk double- reciprocal plots to insure that substrate was approximately three-fold in excess of Km. Results from the 120 min incubations were used for the data presented here by obtaining nM MU and then pmoles MU, after converting from the assay volume. GUS activity is expressed as pmole MU/min, in our system normalized to 1x10⁴ spores.
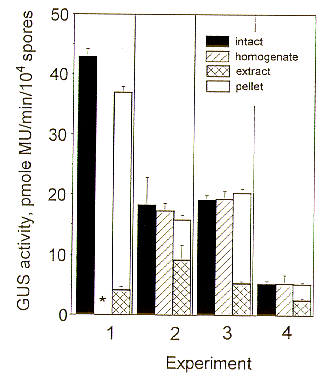
The results from four experiments are summarized in Figure 1. The wild- type strain Y- 117 had negligible GUS activity in intact cells (range, 0.96 - 2.24 pmole MU/min/104 spores). Although the total GUS activity in B3 varied among experiments, the general pattern was the same: The sum of the GUS activity in extract and pellet very closely approximated the total GUS activity in intact cells. The reason for the variability in GUS activity among experiments is not clear. Southern hybridization analysis (data not shown) suggested integration of unmodified, tandemly repeated copies of plasmid at the same site. There was no obvious difference between patterns evident in B3 working cultures and those taken directly from cryogenic storage. However, the former were not kept under hygromycin selection pressure; possibly one or more copies of the plasmid may have been deleted from most or all of the cells; alternatively the entire construct may have been lost from a small percentage of the cells.
The pellets contained appreciable GUS activity (Figure 1), especially if the abrasive was ground glass (Experiment 1, Figure 1) rather than alumina (Experiments 2-4, Figure 1). Since ground glass did not appear to homogenize cells as thoroughly as alumina powder, less enzyme may have been released into the extract. Washings from pellets contained virtually no activity (range, 0.95 - 1.22 pmole MU/min). The same pattern of results was found in separations by Sephadex G- 25 spin columns (not shown).
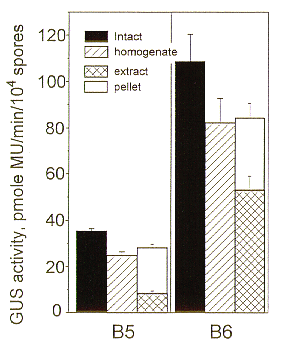
To confirm the pattern observed with the B3 transformant, we repeated the experiments with transformants B5 and B6; the same trend was observed (Figure 2).
Because significant quantities of GUS activity were found in pellets, one important implication of these data is that reports based solely on GUS activity in extracts, which has been the case typically to date, may be misleading. The degree to which this is a source of error in GUS research obviously depends on the method and rigor with which cell- free and debris components are separated. Usually these fractions have been prepared only by a low speed centrifugation step (Gallagher 1992 ibid; Bauer et al. 1993; Flaherty et al. 1995 Appl. Envir. Microbiol. 61:2482-2486) as was done here.
Our research shows that GUS activity in blastospore populations of A. pullulans can be rapidly and accurately monitored by fluorometry without the need to homogenize cells. This modification simplifies, expedites, and renders more accurate the conventional GUS assay based on homogenization. How broadly applicable it may be, especially for species with thick-walled or melanized spores which may inhibit diffusion, awaits further application to other fungi.
This project was supported in part by grants from the EPA (R819377), NSF (DEB 9119476) and USDA Hatch to J.H.A., and from the USDA to S.A.L. We thank M. McGrath and M. Farman for comments on the manuscript, and S. Li for doing one of the Southern hybridization analyses.

Figure 1. GUS activity (average +/- SD of 5 replicates) in B3 GUS- transformed A. pullulans as measured fluorometrically from intact, permeabilized fungal cells and in variously processed fractions of homogenized cells. *homogenate not assayed

Figure 2. GUS activity in A. pullulans GUS transformants B5 and B6. Legend as in Figure.1.
Return to the FGN 44 Table of Contents